Show Me Your Code: Binary White Dwarfs & Melize Ferrus
I’ve been chatting recently with Melize Ferrus, currently working on PhD in physics and studying various aspects of gravitational waves.
It’s not an area I have much expertise in, but through a series of chats and playing around with some of code (and making some fun demos), I thought I’d discuss what I’ve learned. This is not a deep dive into the physics, but rather an exercise in cross-discipline communication, and a chance to play with some Python code. I wrap up with a Q&A to hear take on physics and collaboration.
I’ve asked Melize to write some clarifications and commentary, which will appear in block quotes like this:
What it do, what it does 🥘
The rest of the text is my understanding, and may contain errors. Anything you see that is wrong is my fault, not Melize’s (including quote transcription). Everything should be prefixed with “I reckon”. You can read more about Melize’s work on gravitational waves in this article.
Melize’s code is closed source for now while works on some active areas of research, but I was
given access to it for this exercise. The astropy
and numpy libraries are used extensively.
The Problem Area
The code that Melize shared with me was looking at binary white dwarf (BWD) systems. These are pairs of white dwarf stars (which are the cores of dead stars) orbiting each other.
There are a few reasons why these systems are interesting to study. From what I gather though, of particular interest is that when these stars get close to each other, they can produce very small gravitational waves.
When the white dwarfs get close enough that they become bound and start orbiting each other, they emit gravitational waves. We’re mostly looking at ones inside our own galaxy, because anything further out would be way too faint to detect.
It is difficult to detect gravitational waves from such small systems, but the reason why we care is that they contribute noise, or “background radiation”, to the gravitational wave signals we do care about, such as those from black hole mergers.
Therefore, understanding these white dwarf systems helps us to better interpret the gravitational wave data we receive from detectors like LIGO and Virgo.
In my case the work’s for LISA — the space-based gravitational wave detector. It’ll be much more sensitive and looks at a totally different frequency range than the ground ones like LIGO or Virgo. You need it in space, because the arms have to be effectively millions of kilometers long. Ground detectors catch signals lasting less than a second; LISA will see them for weeks or even months. That means we can detect black holes long before they merge and coordinate with telescopes to watch the same event. It’s going to open up a lot for cosmology and multi-messenger studies.
So how does Melize’s code tackle this problem?
The Code
I saw that Melize’s code had two main parts, both of which use Gibbs Sampling. Gibbs sampling is a statistical technique used to generate samples from a probability distribution. We don’t need to use “real” data points from astronomical observations, especially with the number of data points we need. Instead, we can use our models of the Galaxy and the binary white dwarf systems to generate synthetic data points that are statistically similar to what we might observe.
I’d maybe mention it’s a Monte Carlo method — Gibbs sampling is just one type of that. There are a bunch of approaches; this is the one I happened to use.
The two main uses of Gibbs sampling in code were:
- Drawing samples of what the binary white dwarf systems might look like (e.g., their masses, distances, and orbital periods).
- Generating where in the galaxy these systems might be located.
Boffins have modelled what we think the distribution of these systems looks like, and this code is drawing samples from this distribution. The specifics of the distributions are not important for this discussion, and not something I’ve taken the time to understand.
It’s only separated into two parts because I’m lazy. Theoretically they could all live in the same Gibbs sampler. It’s on my to-do list to merge them into a proper joint distribution.
Binary White Dwarf Systems
When we generate a sample of a binary white dwarf system, we are generating:
- The mass of the first white dwarf (in solar masses).
- The mass of the second white dwarf (in solar masses).
- Their semi-major axis (in solar radii) — essentially the orbital radius, but these orbits aren’t circular.
- Their orbital eccentricity (what shape their orbit is).
Semi-major axis is the halfway point of the furthest distance between the two bodies in their orbit.
For example, a sample I generated from Melize’s code was:
Example Binary White Dwarf System
\(\begin{aligned} m_1 &= 1.33\,M_\odot \\ m_2 &= 0.64\,M_\odot \\ e &= 0.38 \\ a &= 7.26 \times 10^5\,R_\odot \end{aligned}\)
To help with my own exploration, I also gave each system a random name using 2 words from the EFF Long Wordlist.
E.g.,
overrun-nicotine
stack-thursday
goldmine-undesired
strained-hurried
ecologist-undead
cherisher-degree
supermom-unsigned
rescuer-sternum
zebra-crepe
From this code, we can generate as many samples as we want, and our set of binary white dwarf systems will be distributed according to our model.
Melize, what can we do with these samples?
What I’m actually computing is the gravitational-wave power contributed by all the white dwarfs at each discrete frequency. E.g., using some nonsense numbers and units, it might give one million watts at 1 mHz and something else at 10 mHz. Let’s say those are the bands LISA’s interferometer is looking at, and that helps us correct our observations. That’s my focus, though you could use the samples for other analyses too.
Galactic Coordinates
We expect the white dwarf systems to be distributed around the Milky Way galaxy, with a higher density towards the center of the galaxy, and a lower density as we move away from the center.
The galaxy is modelled as a disk, with a bulge in the center. Melize’s model generates “2D cylindrical galactic coordinates”, which are:
- (R): radial distance: the distance from the center of the galaxy.
- (Z): the vertical distance above or below the galactic midplane.
The coordinates are cylindrical — the center of the galaxy’s at (0, 0). They’re distributed to match how main-sequence stars are spread throughout the Milky Way. From a logical standpoint they’re just dead stars, so BWDs will be wherever stars are. I can’t think of a strong reason for their distribution to be very different.
This is in contrast to the more familiar Cartesian coordinates (x, y, z).
However, to convert from galactic coordinates to Cartesian coordinates, we also
need the “azimuthal” angle (φ), which is the angle around the center of the
galaxy. This requires an assumption about how the systems are distributed
around the galaxy. This isn’t necessary for Melize’s work, but I wanted to
visualise the results in a format I was more familiar with.
Therefore I added a third step to the code, which was to draw a random angle
between [0, τ], and then convert from galactic coordinates to Cartesian ones.
We already have the Z coordinate, and we can convert from (R, φ) to (x, y)
using:
\(\begin{aligned} x &= R \cos(\phi) \\ y &= R \sin(\phi) \end{aligned}\)
For what I’m doing, you do eventually need the azimuthal angle because you need to know where the binary is located relative to the gravitational wave. But it’s uniform, so there’s no need to sample it — it’s just drawn uniformly, sometimes conditional on other factors.
Visualisation
With Melize’s code, and some minor data transformation, we can now generate 5,000 BWD systems, and also generate their positions in the galaxy. The code is capable of generating as many samples as we want, but for my purposes I kept the number small.
This plot is interactive, using the plotly library, and its go.Scatter3d
tool. I initially made this in a Jupyter notebook, and then exported it to a
format that can run in the browser using Plotly’s JavaScript library, using
fig.write_json("2025-10-binaries.json").
# Create an interactive 3D scatter plot of the sampled systems
import plotly.graph_objects as go

fig = go.Figure(
    go.Scatter3d(
        x=x,
        y=y,
        z=z_vals,
        mode="markers",
        text=hover_text,
        hoverinfo="text",
        marker=dict(
            size=3,
            color=m1_vals,
            colorscale="Turbo",
            colorbar=dict(title="Primary Mass [M☉]", tickcolor="white"),
            opacity=0.8,
        ),
    )
)
You can see it below, if your browser supports it.
If you hover over a point, it will show you the details of that binary white dwarf system, including the randomly generated name I added.
Audio Shenanigans
Next, I wanted to do something more playful. Using the generated BWD systems, I tried out a few techniques to turn them into musical notes. I spent some time tuning how different parameters influenced the audio.
I’ve not done much audio programming before, so I kept it simple, using 4 basic waveform types: sine, square, snare, and kick.
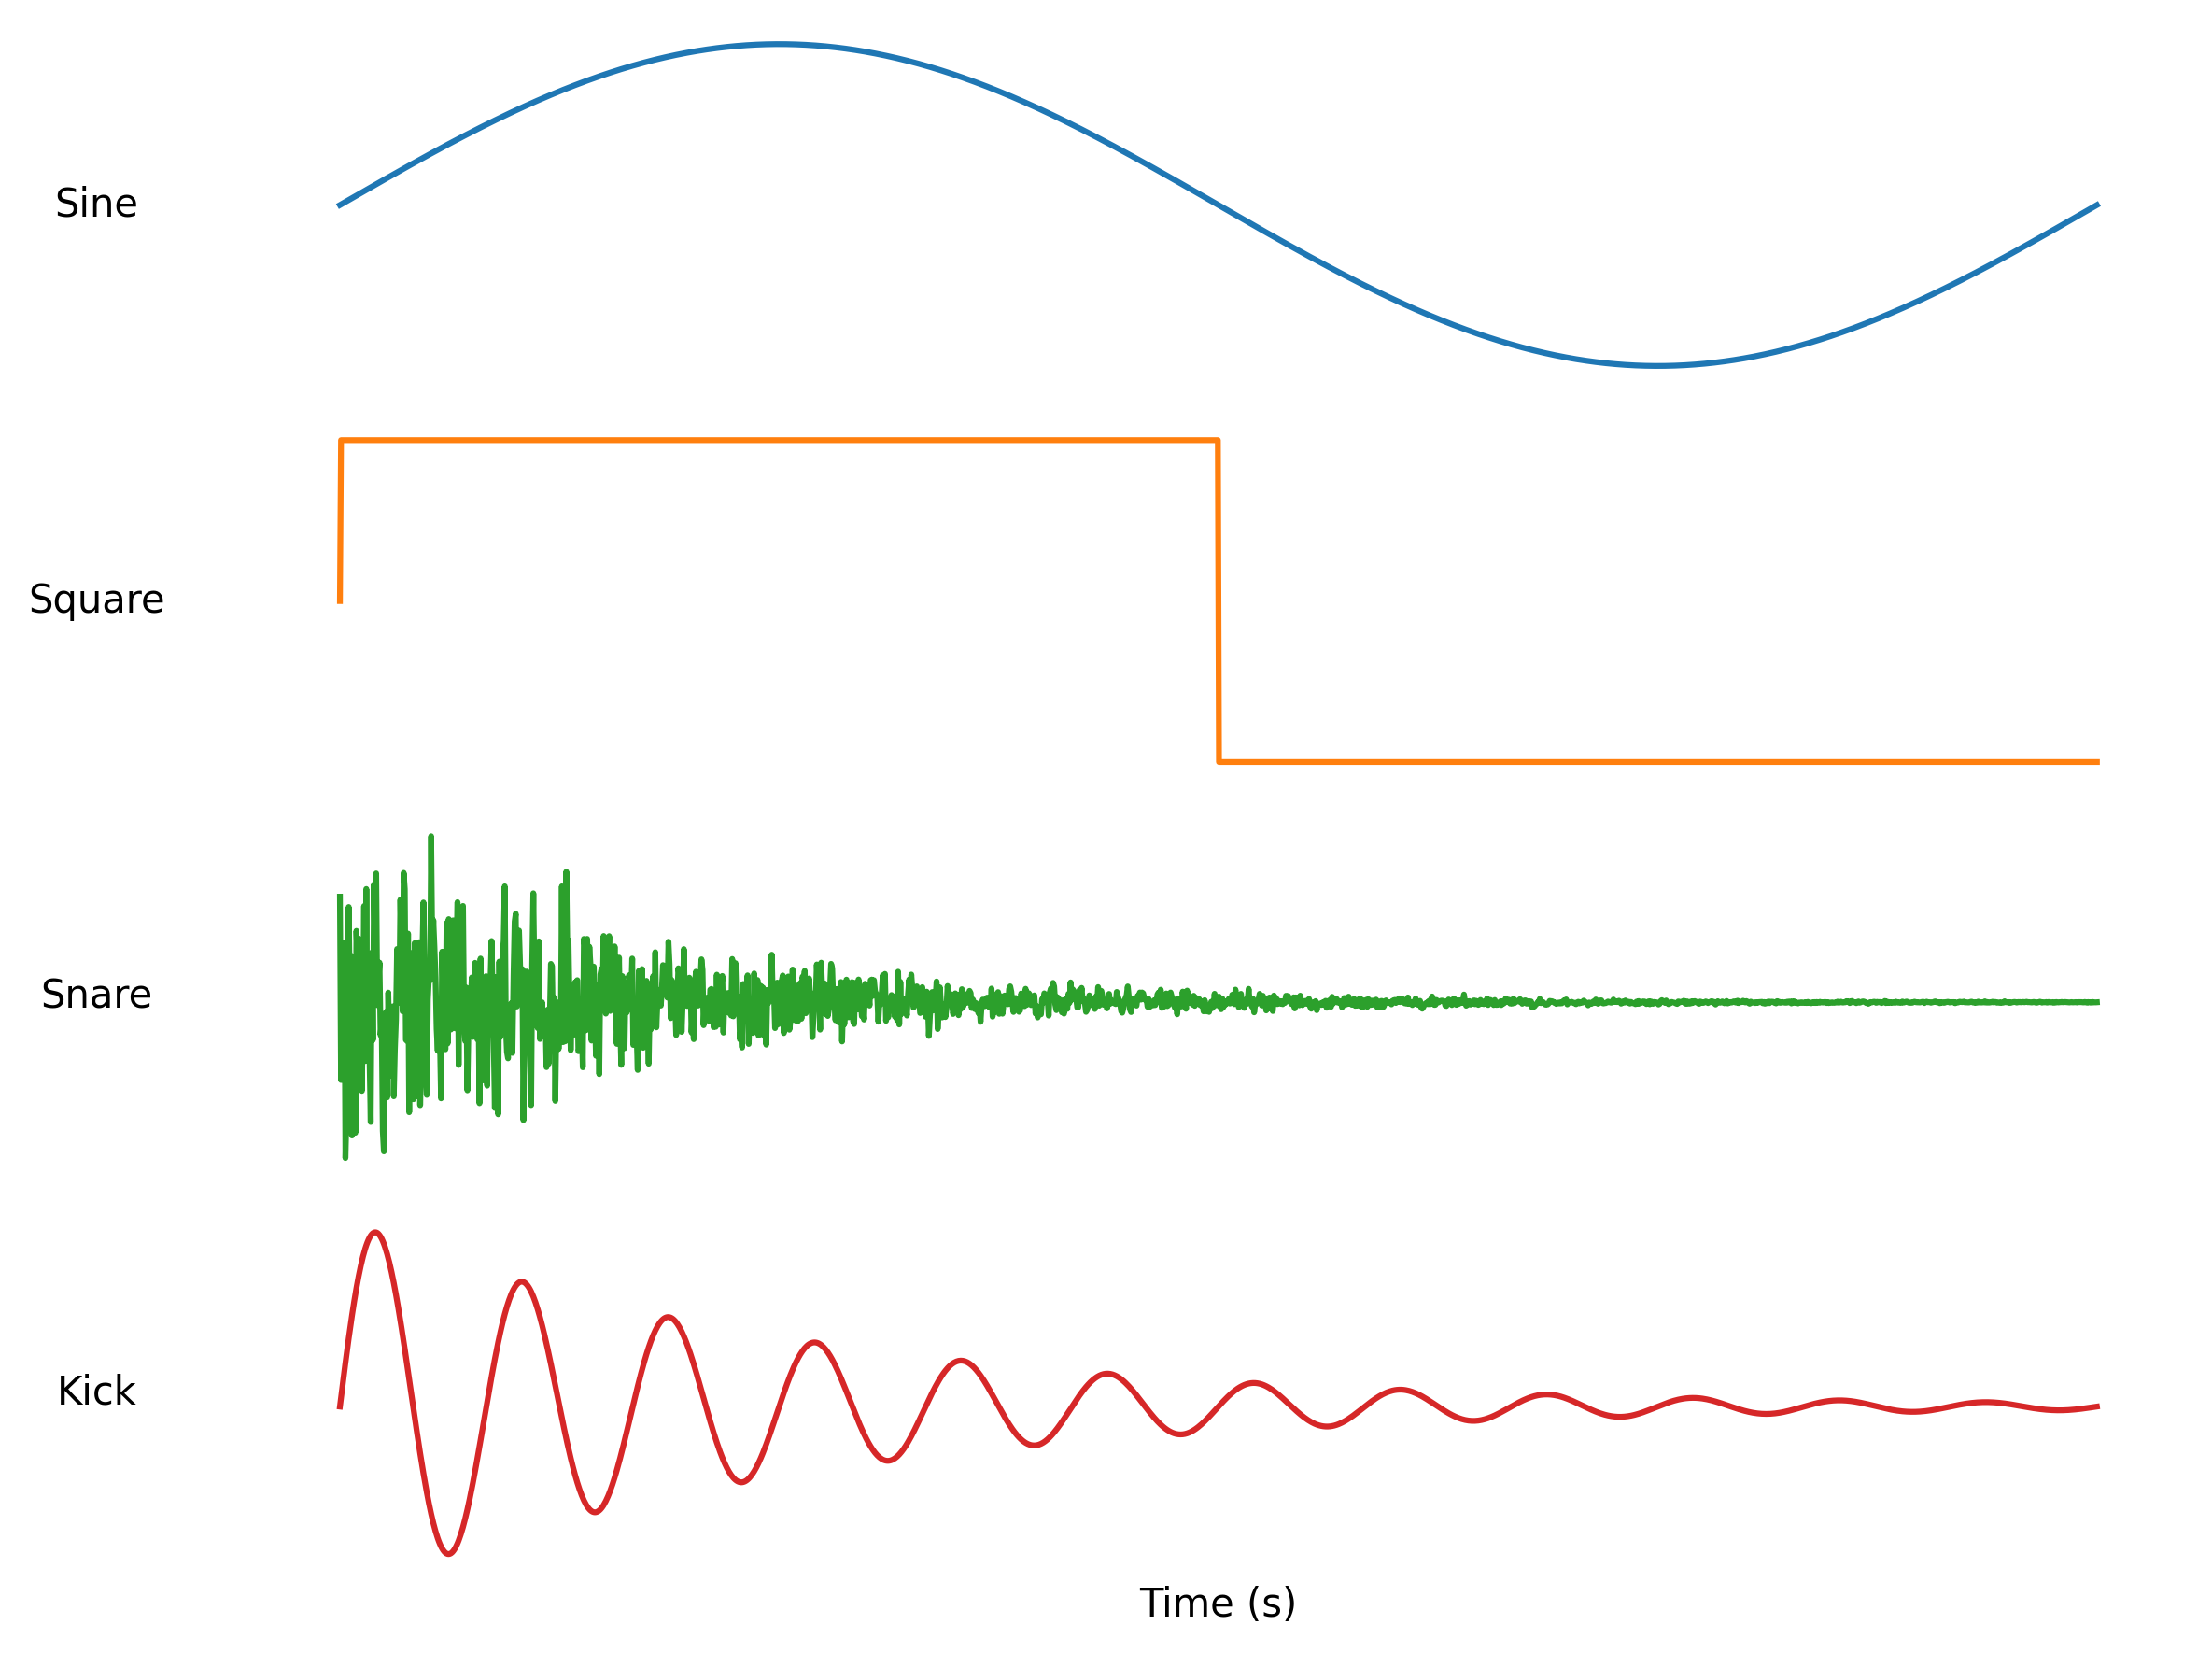
I generated a bunch of BWD samples, and checked the parameter ranges so I could normalise them.
My code ended up being quite hacky:
def bwd_to_voice(m1, m2, e, a, norm_ranges):
    """Map BWD parameters to sound features and instrument type."""
    nm1, nm2, ne, na = norm_ranges
    mass_avg = (m1 - nm1[0]) / (nm1[1] - nm1[0] + 1e-9)
    ecc = (e - ne[0]) / (ne[1] - ne[0] + 1e-9)
    sep = (a - na[0]) / (na[1] - na[0] + 1e-9)
    q = m2 / m1
    asym = abs(m1 - m2) / m1

    # instrument choice
    if mass_avg > 0.8:
        voice = "kick"
    elif ecc > 0.7:
        voice = "snare"
    elif asym > 0.3:
        voice = "square"
    else:
        voice = "sine"

    freq = 100 + 800 * mass_avg
    dur = 0.2 + 0.8 * (1 - sep)
    vol = 0.3 + 0.7 * ecc
    return freq, dur, vol, voice
With a constant BPM, I passed binary white dwarf systems through this code, making one note each, and generated the following track:
A tad atonal, which makes sense since we’re mapping astronomical parameters to musical ones without any harmonic constraints. Maybe I need to read more music theory. However, it grows on me the more I generate and listen to it.
Perhaps it’s hubris to think that randomly generated white dwarf systems would immediately make good music, but it’s fun to try.
I can’t wait to somehow contribute to a future post where we come at music from the mathematical angle — figuring out what makes music sound good without actually knowing what the notes mean.
Q&A
Now that I’ve shown some of my hacking around with Melize’s code, here I take the opportunity to ask some general questions.
What got you interested in this area of research?
Honestly, nothing in particular. I always wanted to be an astronomer as a kid. At some point I realized I liked physics, so I thought astrophysics would be cool.
But I didn’t really know how to read my college website properly, so I didn’t realize they didn’t even have astronomy. I knew they had physics, but I didn’t check the course list well enough. Once I was there, I realized—oh, there’s nothing astronomy-related here.
I got involved in aerospace engineering stuff for a bit, then kind of gave up and moved on. Later, I heard about an internship at the Flatiron Institute for people in the National Society for Black Physicists. I applied, got sent a list of different research topics, and picked my top three. The one I ended up doing was literally my lowest-ranked choice.
I think my top pick was something about solar oscillations, and the second one I forget. But yeah, I ended up getting the third one, and over the course of the internship I realized I really liked it. So there was no grand plan like, “I’ve always wanted to work on black holes.” It just kind of happened.
What are some big open questions in this area of research that you’re interested in?
I work across a pretty wide range of things in gravitational waves. What I’m doing now is different from what I did with at Flatiron, and different again from what I did at King’s.
On the numerical relativity side, one big question is whether we can come up with a model or theorem that works for the merger phase of black hole collisions. We already have post-Newtonian approximations for the inspiral, and quasi-normal modes for the ringdown. Those let you predict what the gravitational wave looks like if you know the parameters of the system.
But for that last bit, right before the black holes coalesce, there’s no theorem—just heavy computation. It would be great if we had a simpler equation or model instead of running six-hour-long simulations for that one stage.
Then there’s eccentricity. Black hole mergers can have different eccentricities, and that changes the whole signal. But those effects can look like other things—spin, non-vacuum conditions, whatever. So it’s hard to tell what’s what. We usually assume circular orbits, but they’re often not. Understanding the typical black hole orbit better would help a lot—both for improving models and for things like star formation studies.
For the LISA mission, a huge open question is what we’ll learn about cosmology. LIGO only catches the last second or so of a merger. LISA will detect black holes a month in advance. That means you can get detailed parameters early, subtract out the known signals, and study what’s left—possibly signs of inflation, cosmic strings, or first-order phase transitions. The future looks really exciting for cosmology.
You deal with some pretty large simulations and computations. Would you say that programming is a big part of your work? Is there enough collaboration between physicists and computer experts?
Yeah, programming’s a big part of it. But I’d say most physicists are computer experts only in the sense that they know enough to make their own stuff work. We’re not computer experts broadly.
Like, you [ed: Perry] know enough physics to help me out with something, but not enough physics overall to anticipate what I might need. Same for me—I know enough computational stuff to get results, but I don’t always follow the best practices. Someone else could look at my code and think, “Sure, it works, but this could be done way better.”
There could definitely be more collaboration. Everyone’s under pressure to produce results quickly, so code often ends up written in brute-force, opaque ways. Later, when new people join, they spend weeks just figuring out what the code even does. Half of it could’ve been explained in a docstring or wiki.
A lot of scientific code isn’t open source. That really limits reproducibility and collaboration. Sometimes groups hoard code to keep control—people have to email them to run a simulation instead of doing it themselves. Then those teams rack up citations for just pressing run. Nothing’s truly replicable because others can’t see the underlying code.
I’ve even been on papers where the authors said they were using the “highly precise [system] code.” But how do you know it’s precise? You’ve never seen the infrastructure. Everyone assumes it’s right because a big name’s attached. It’s very anti-scientific—this blind trust that something’s correct just because of who made it.
Amongst other things, you’re black, and present pretty femme, which is still relatively rare in physics. Have you had any interesting or noteworthy experiences through this lens?
I’ve got a few specific examples, but I don’t want to call anyone out.
I get mistaken for other people a lot, even at conferences. It happens so often it’s almost funny, except it’s not.
Like, once at a conference, I asked in the group chat if anyone had painkillers because I had cramps. A guy brought me one, fine. The next day, he said he’d seen “me” while biking and shouted, “Do you still need the drugs?”—but it was just some random woman with similar hair. He figured that must be me.
I’ve also been to plenty of conferences where no one sits with me. Literally, people will fill every seat around me but not next to me. It feels isolating.
It’s not that anyone’s openly rude. It’s just that constant, quiet exclusion. Seeing your peers welcomed while you’re sidelined makes you ask why. It’s tiring.
What are the biggest uncertainties in the models you work with?
Oh, huge ones. One of the biggest is the merger rate—how many mergers happen per year. The uncertainty can be as large as the value itself.
Let me bring up one of my favorite ones. It’s very entertaining to me
( types on laptop for a moment, then starts laughing.)
Here we go: neutron star mergers [page 26]. The estimated rate is 920 per gigaparsec cubed per year, with a +2,220 / –790 margin!
Hands down, that’s my favourite. I roll around in my non-existent grave to this shit. It’s a couple of years old, so newer estimates are probably tighter now. This is for the first two observations of LIGO with the neutron star detection for the collision rate.
Yeah, I have a lot of confidence in all of the different things I generate using those kinds of things…
Anything else you want to say?
I really like the kind of work I do. I’ve been lucky to move between institutions and completely change up what I’m working on each time.
After my year at Flatiron I felt cocky about starting my PhD, “I run this bitch,” but when I got to King’s it was like starting from scratch again due to the alternative perspectives on the topic. It’s cool seeing how much undergrad material—stuff I once thought was useless—actually shows up all the time.
In undergrad, you’re rushing to master something in 13 weeks, then it leaks out of your head. Doing a PhD gives you the time to actually learn it properly. None of my physics education was a waste. Even the quantum mechanics I thought I’d never need has ended up being useful.
It gives you time to learn the thing properly, as opposed to learn the thing in order to pass the test. Yeah, so like if you didn’t do everything perfectly in your undergrad, it’s fine. I think it’s just that doing a PhD gives you more appreciation of it.
Thank you Melize.
Thank you Dr Gibson, I’ll see you on GitHub 🙂↕️.
Conclusions
When I talk to specialists in other fields who are articulate and passionate about their work, I find it infectious. I usually come away with the feeling of “ah, so it isn’t magic, but it is hard”. I haven’t eaten my intellectual vegetables by working through general-relativity textbook exercises. However, by inhabiting Melize’s code for a while, and picking brain, I feel like I’ve gained a little more appreciation of the field, and the cool people that work in it.